Jitsu includes several aids to help debugging Jitsu apps. A particularly useful one is the inspector.
Click on the Launch Inspector button above to see the inspector running. Then click on one of the other buttons to see sample diagnostic output in the inspector's console (you'll have to bring it back to the foreground)
Launching the Inspector from the Keyboard
If you built your project is build with the "Diagnostics" flag turned on, pressing the F10 key in the browser pops open the inspector.
Keyboard focus
Sometimes clicking F10 does nothing - if this happens, it may be because you need to explicitly need to give focus to the Jitsu window - this may be the case if Jitsu is running inside an iframe, for example. In all the quick tours, you need to click inside the application frame above to get F10 to work, or you can click on the "Inspector" tab of the source browser.
Another reason F10 may do nothing is if you are running in "Release" mode, in which case the inspector is stripped out of the app!
[On Mac OS X, the F10 key may be used for Expose. We are looking at alternatives for that platform.]
Inspector Panes
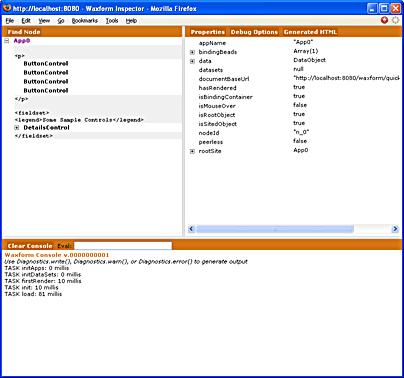
Once launched, the inspector shows a three pane layout:

The Left Pane: Control Hierarchy Browser

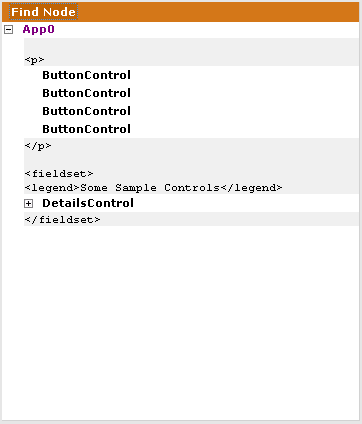
The top-left pane shows the Control Hierarchy - the tree of controls and text that make up the controls for the page.
Any static HTML (i.e. HTML markup which exhibits no interactivity, has no bindings, etc) is shown in gray. All Jitsu Controls are shown in bold.
When a control has children, then a small plus to the left of the control name. Clicking on the plus/minus icon expands and collapses the children.
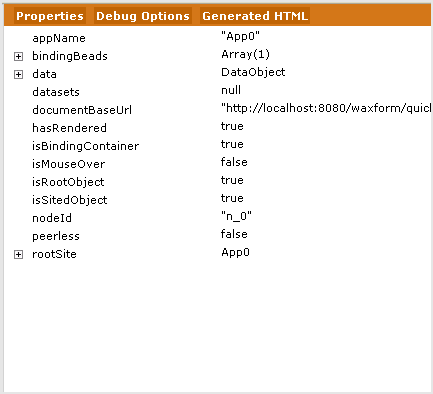
Clicking on a node causes the corresponding control to become selected. When you select a control, the right hand pane shows its properties. In addition, a red outline rectangle is flashed in the main browser window (the one running the app), showing the approximate location where that control appears.
The Right Pane: Properties, Generated HTML

By default, the right pane shows properties of the node currently selected in the left pane.
Clicking Generated HTML changes the right pane to show the output HTML generated for the control selected on the left pane. If you click this and then click different nodes in the left pane, you can see what output the nodes generate. Clicking on "AppControl" in the left pane shows you the HTML for the entire page.
The Bottom Pane: Output Console

The Inspector Console provides a convenient place to write debug output in your applications. If you call:
Diagnostics.write('some string');
The text 'some string' appears in the Inspector Console output window.
Use Diagnostics.warn or Diagnostics.error to generate different color text.
Clicking Clear Console in the inspector resets the console output.
You can type text into the Eval box to evaluate JavaScript expressions via the inspector.
If you use Firebug for Firefox debugging, the output of Diagnostics.write(), Diagnostics.warn(), and Diagnostics.error() will automatically be forwarded to Firebug's console.